Wildland Industrial Interface
July 2023This work follows recent development made in Wildland Urban Interface (WUI) which aims at better understanding and characterizing wildland fire propagation in urban environment. One of the main objective of WUI application is to map the vegetation that has the potential to carry wild fire in the urban infrastrucutre. Here we applied the same concept to industrial infractructure, to help quantifying the wildland fire risk in the context of industry regulation like the European Seveso regulation. This work was publish in Planas et al. (2023).
Here I describe quickly the methodology I developed for the WII computation. The Industrial area map is extracted from the Open Street Map (OSM) data set, and the vegetation area map is extracted from the Gobal Corine Land Cover (CLC) data set.
| European Industrial area from OSM | Simplified 5 vegetation map for europe from CLC, r_veg |
|---|---|
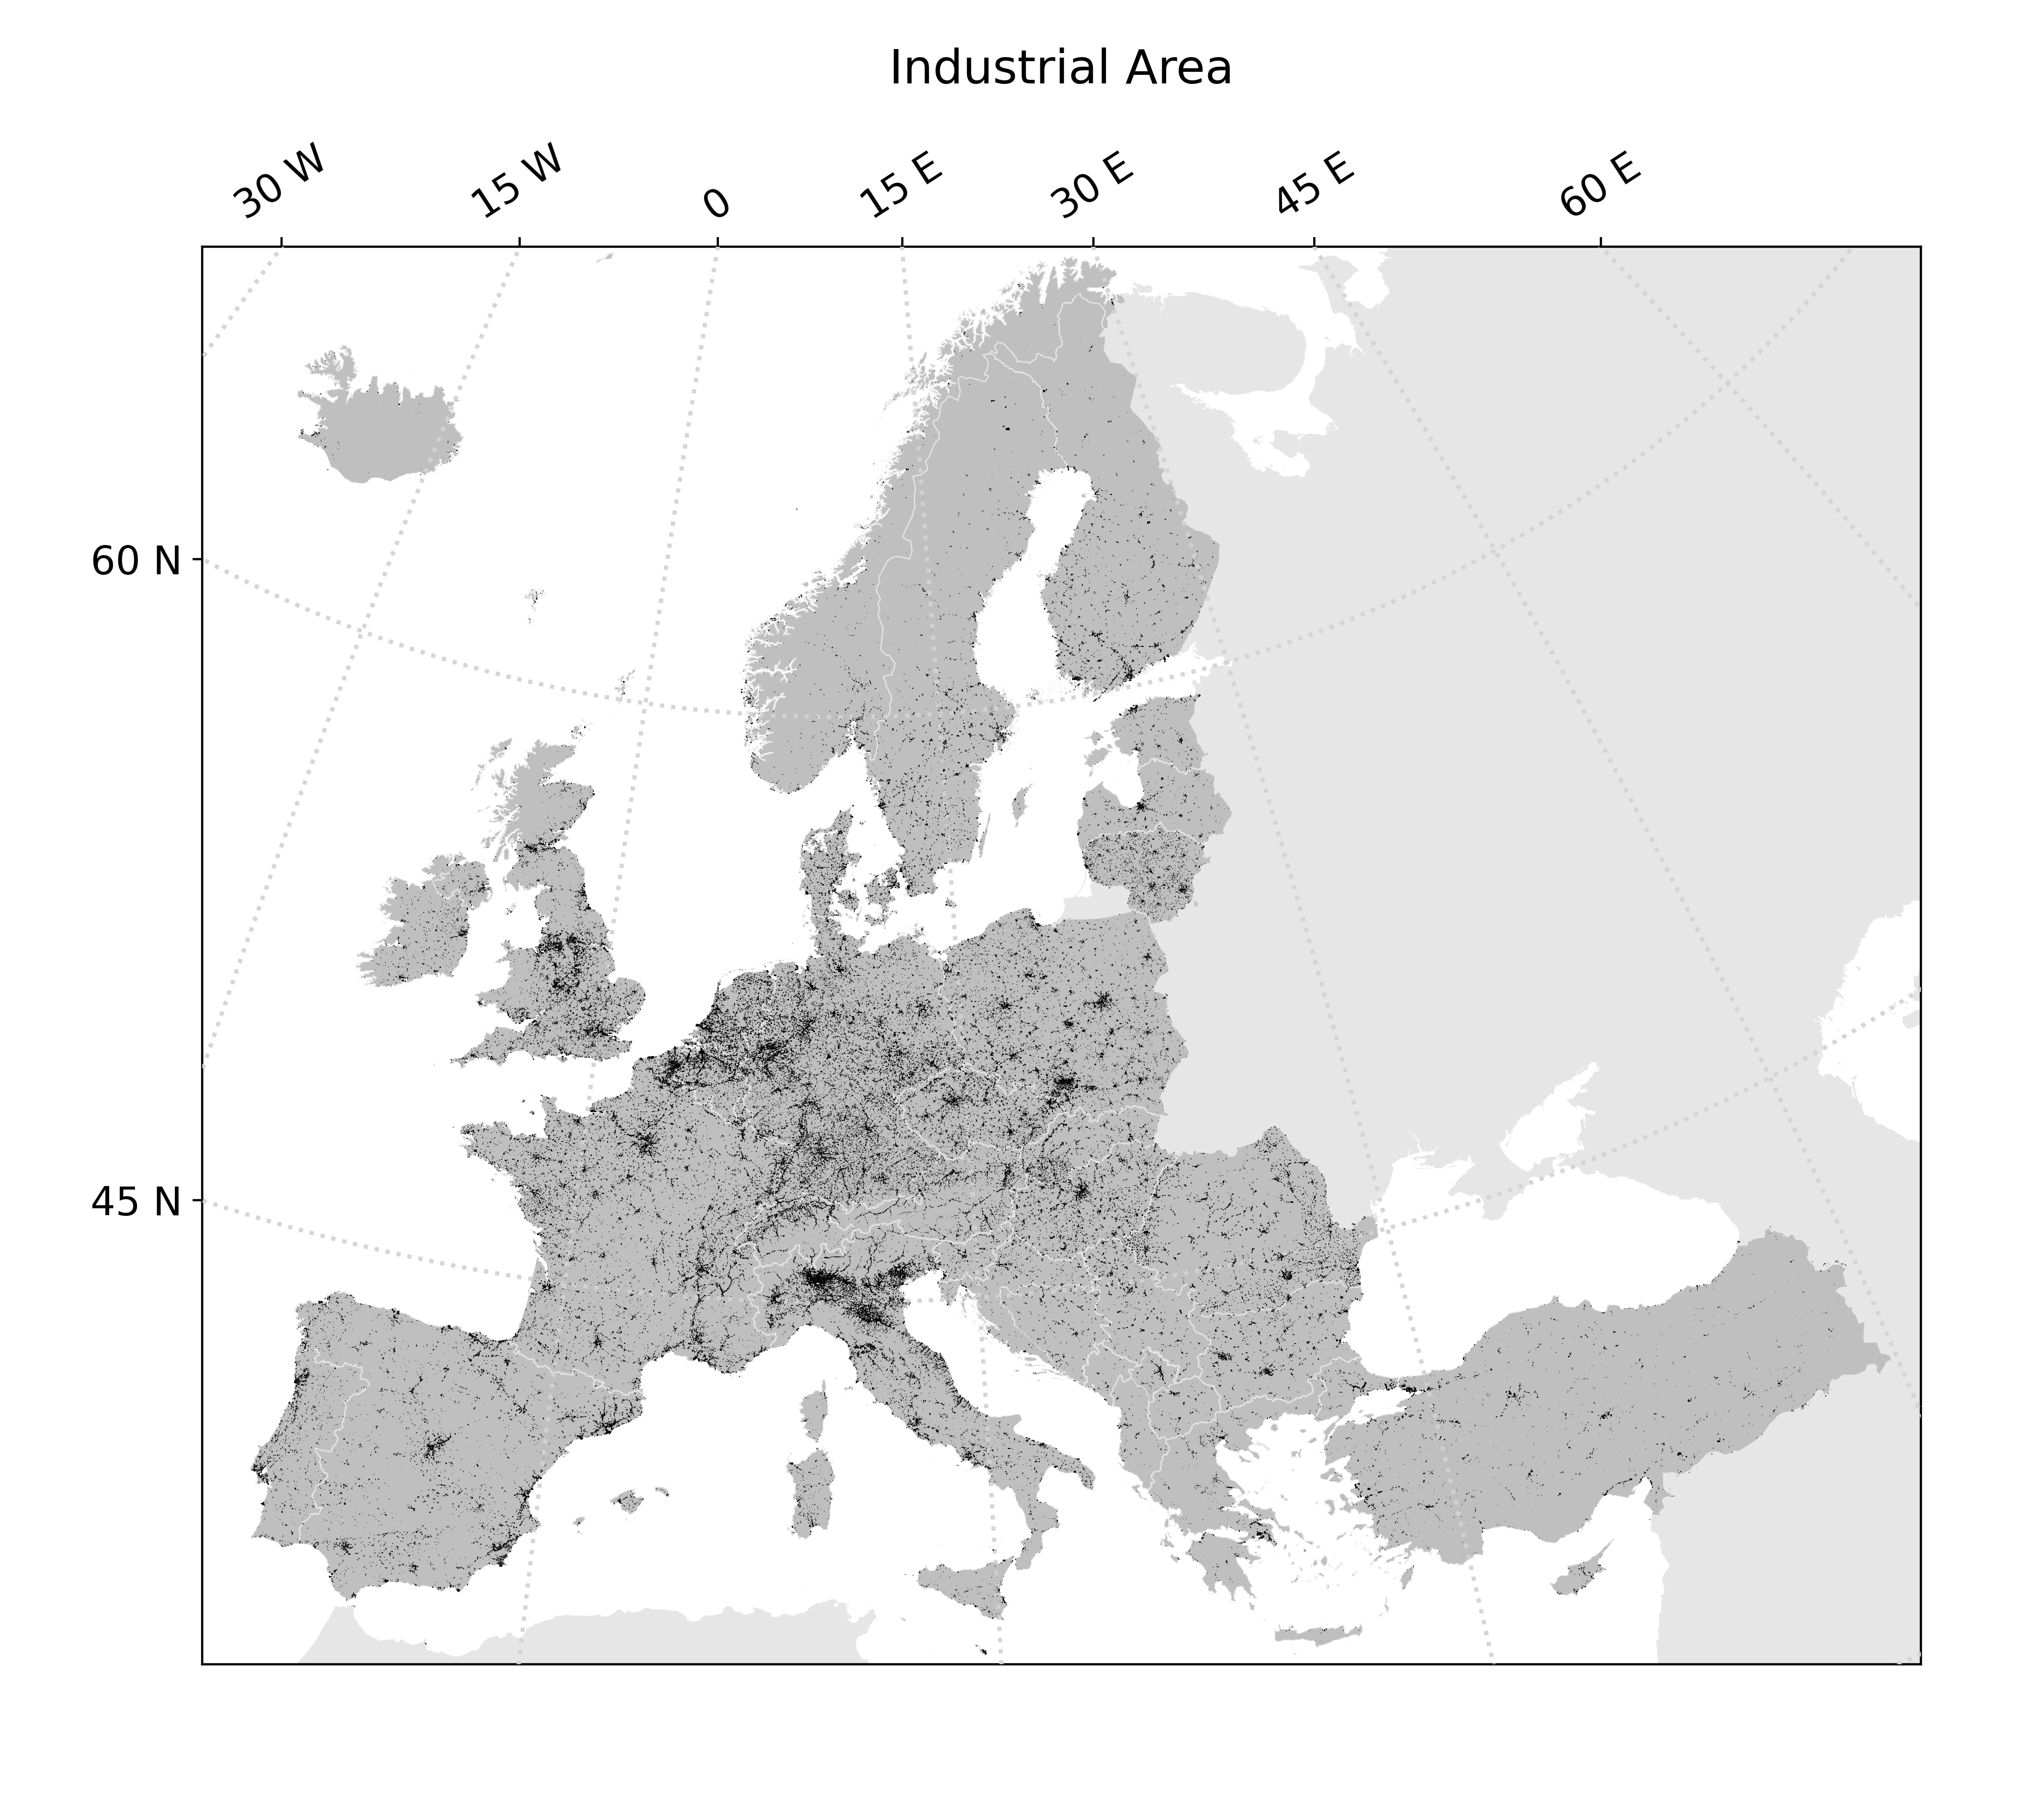 |
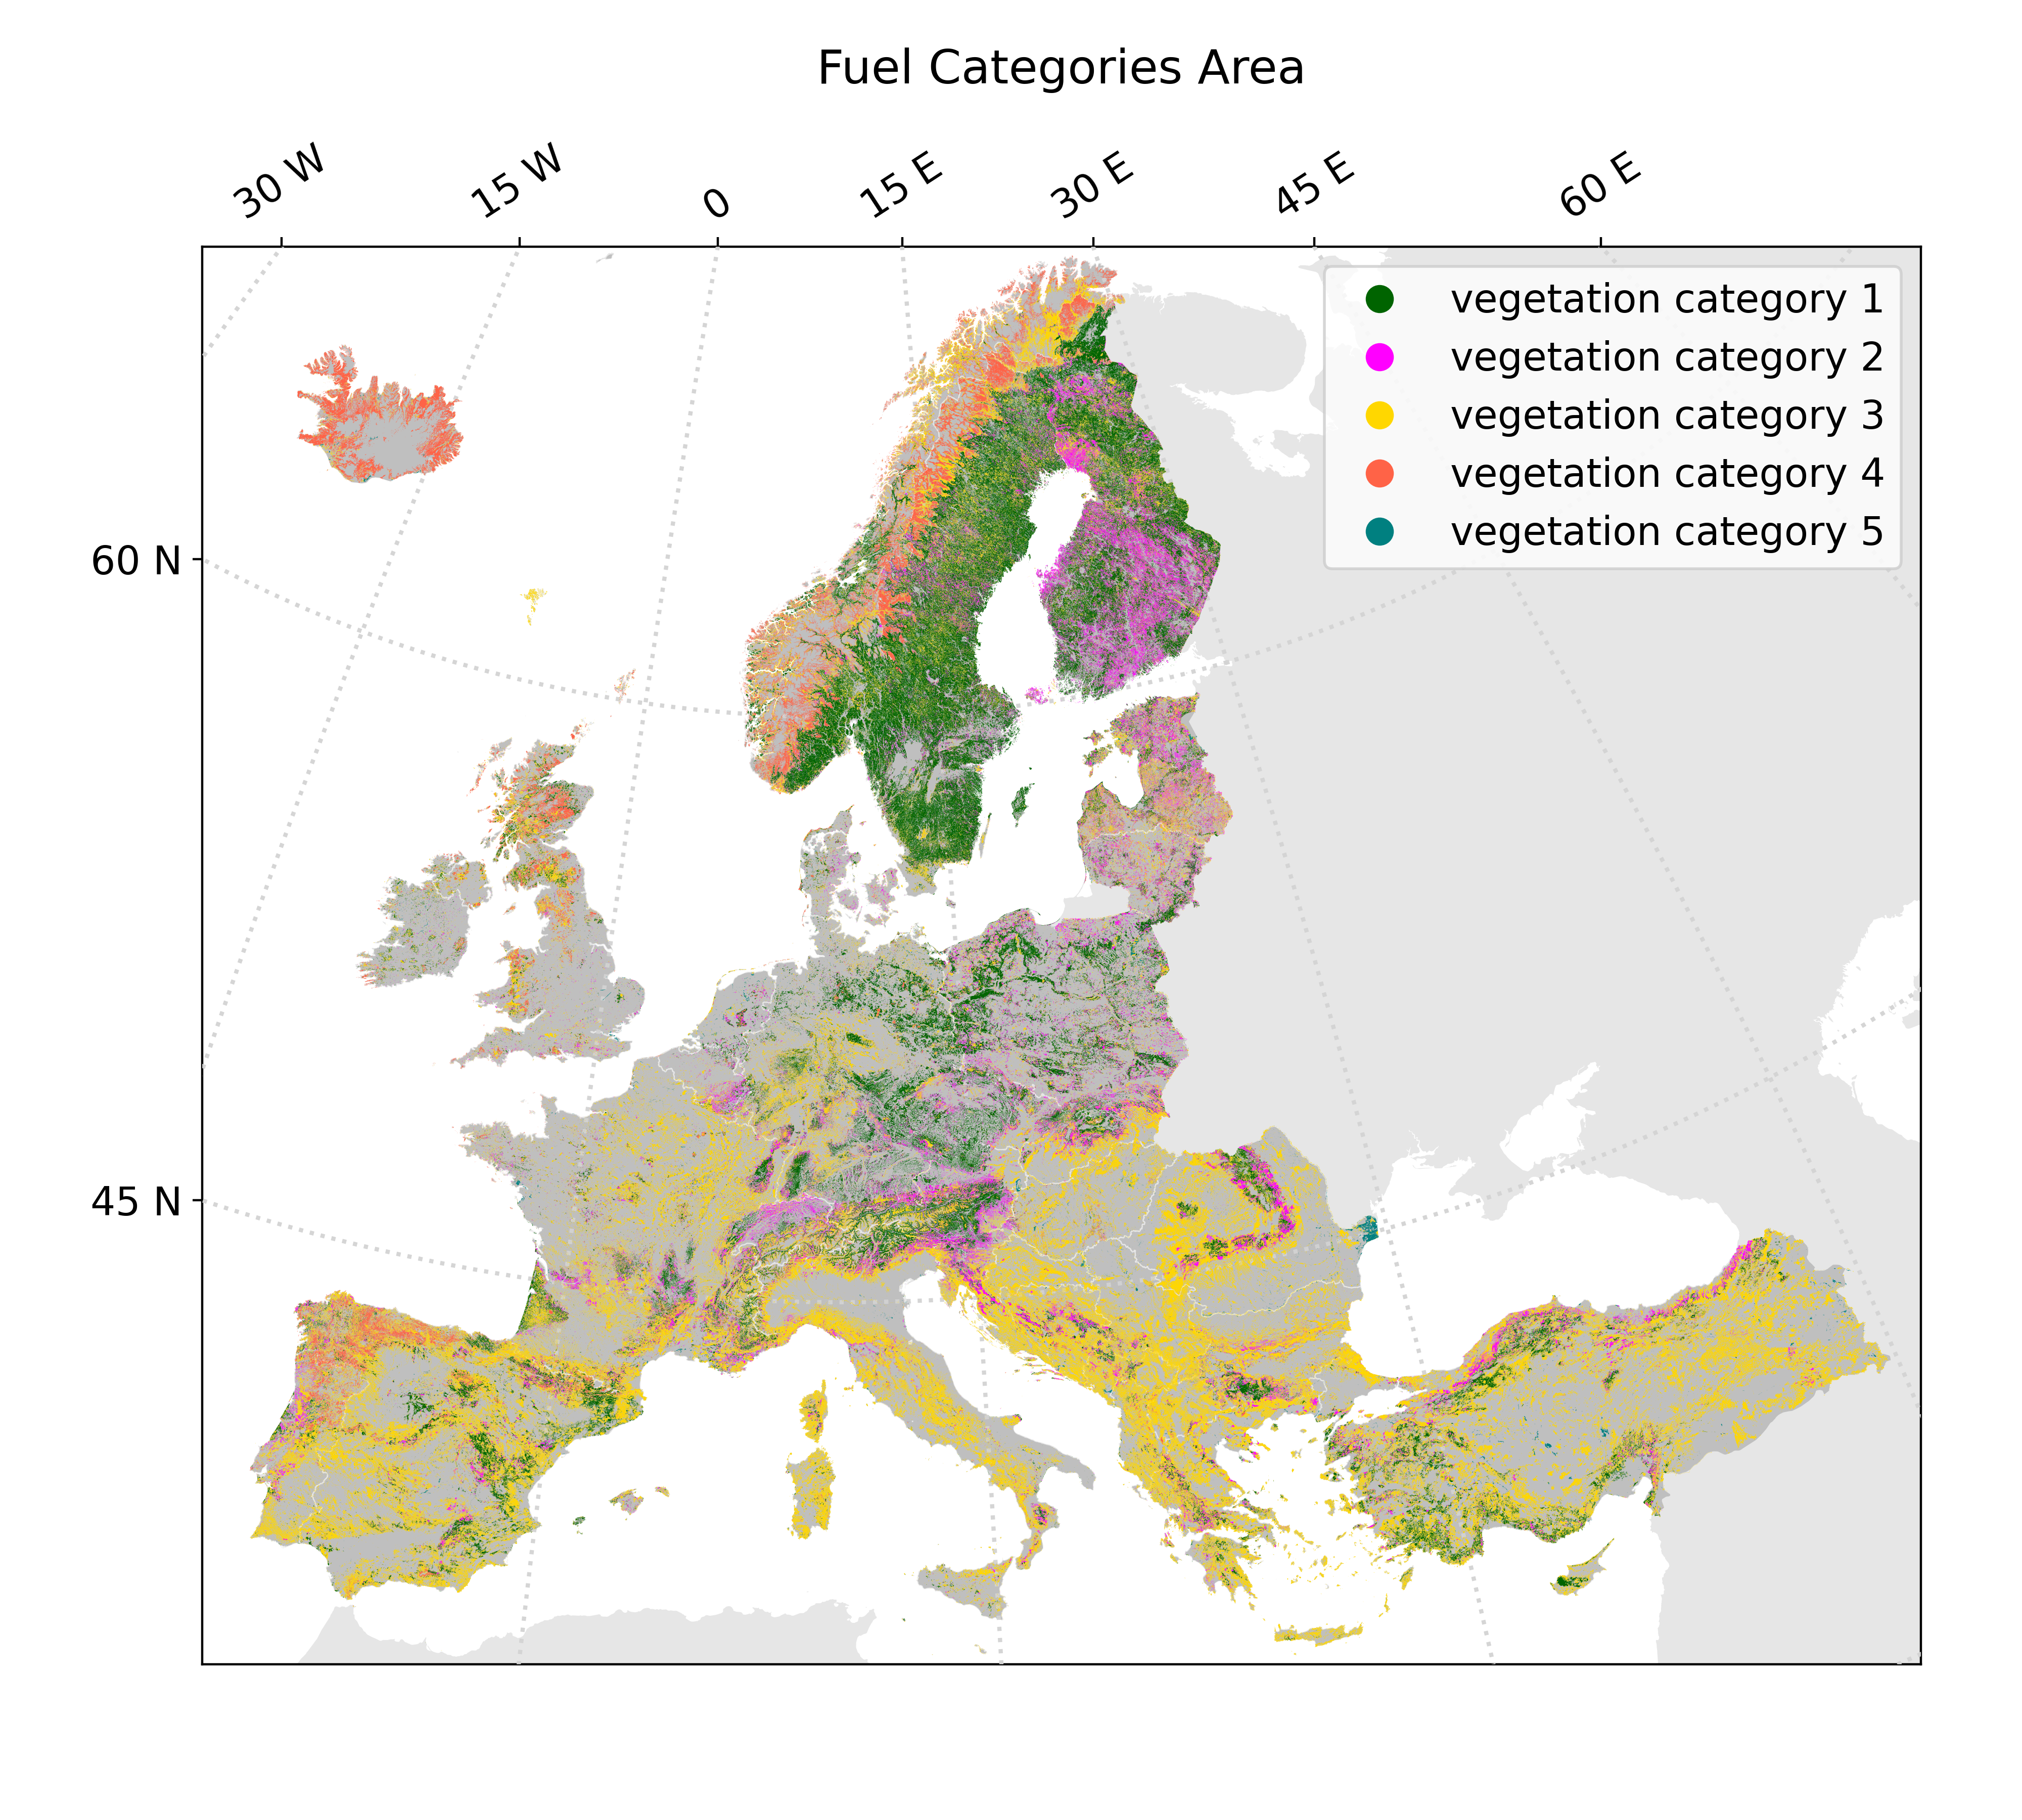 |
The CLC data is simplified to only 5 vegetation categories, and a rank (r_veg=1 to 5) is attributed to each category according to its potential fire behavior intensity. Hence, rank r_veg=1 is attributed to the vegetation with the higher intensity fires, ie coniferous forest, and increasing rank value for lower fire behavior intensity.
Vegetation categories are converted to fire hazard categories by attributing to each vegetation polygon a capability to propagate wild fire. We use as a proxy for fire propagation the homogeneity of the local vegetation distribution (Vega-García and Chuvieco 2006). The homogeneity of each vegetation polygon is defined at the landscape scale by computing its Aggregation Index (AI).
Three homogeneity rank, r_h, are then defined for each polygon of the vegeation aera map following Johnston and Flanningan (2018).
r_h=0is attributed to polygon with high aggregation (AI_>90)r_h=1to polygon with low aggregation (0<AI_poly<90) andr_h=2to polygon with no aggregation (AI_poly=0).
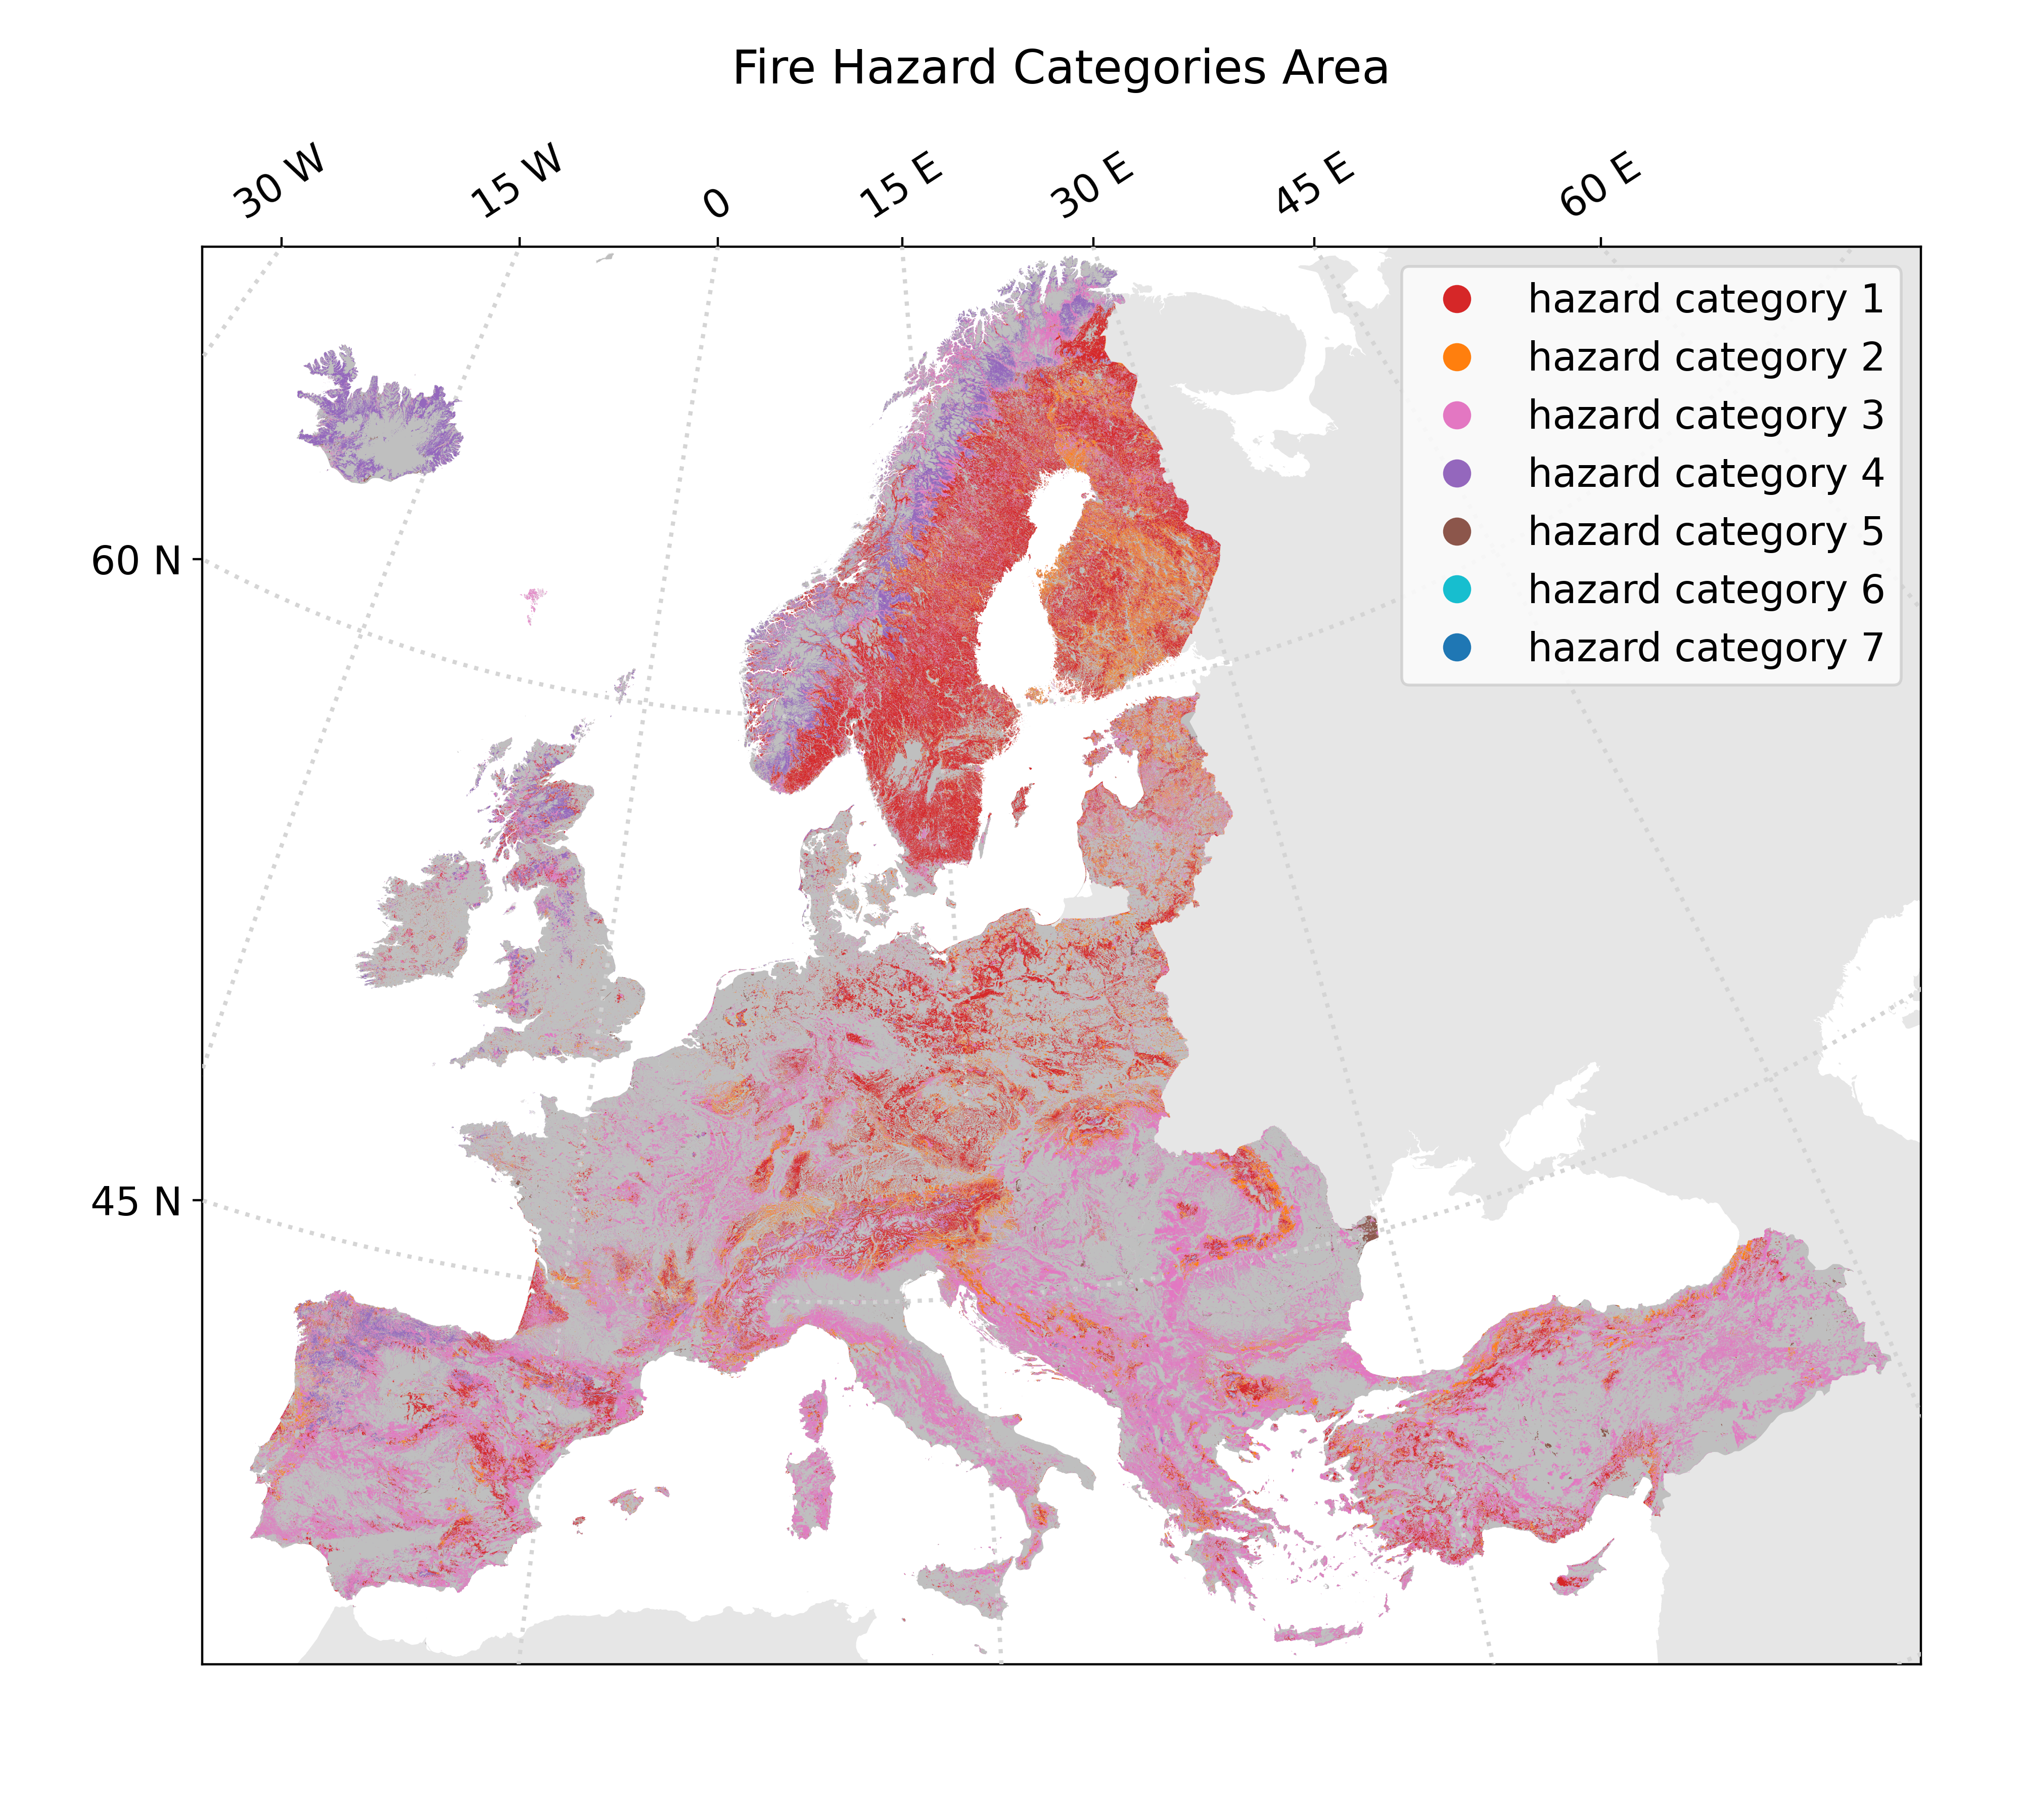
A Fire hazard rank is then classified at vegetation polygon level using fire hazard rank r_fh defined as the sum of the vegetation and homogeneity ranks,
r_fh = r_veg + r_h
A map of the 7 possible categories is shown in Fig3. A distance of interaction d_inter with industrial polygon is attributed to each of the 7 fire hazard categories according following the distance set by Johnston and Flanningan (2018).
euorpean Fire Hazard map r_fh |
European WII map |
|---|---|
 |
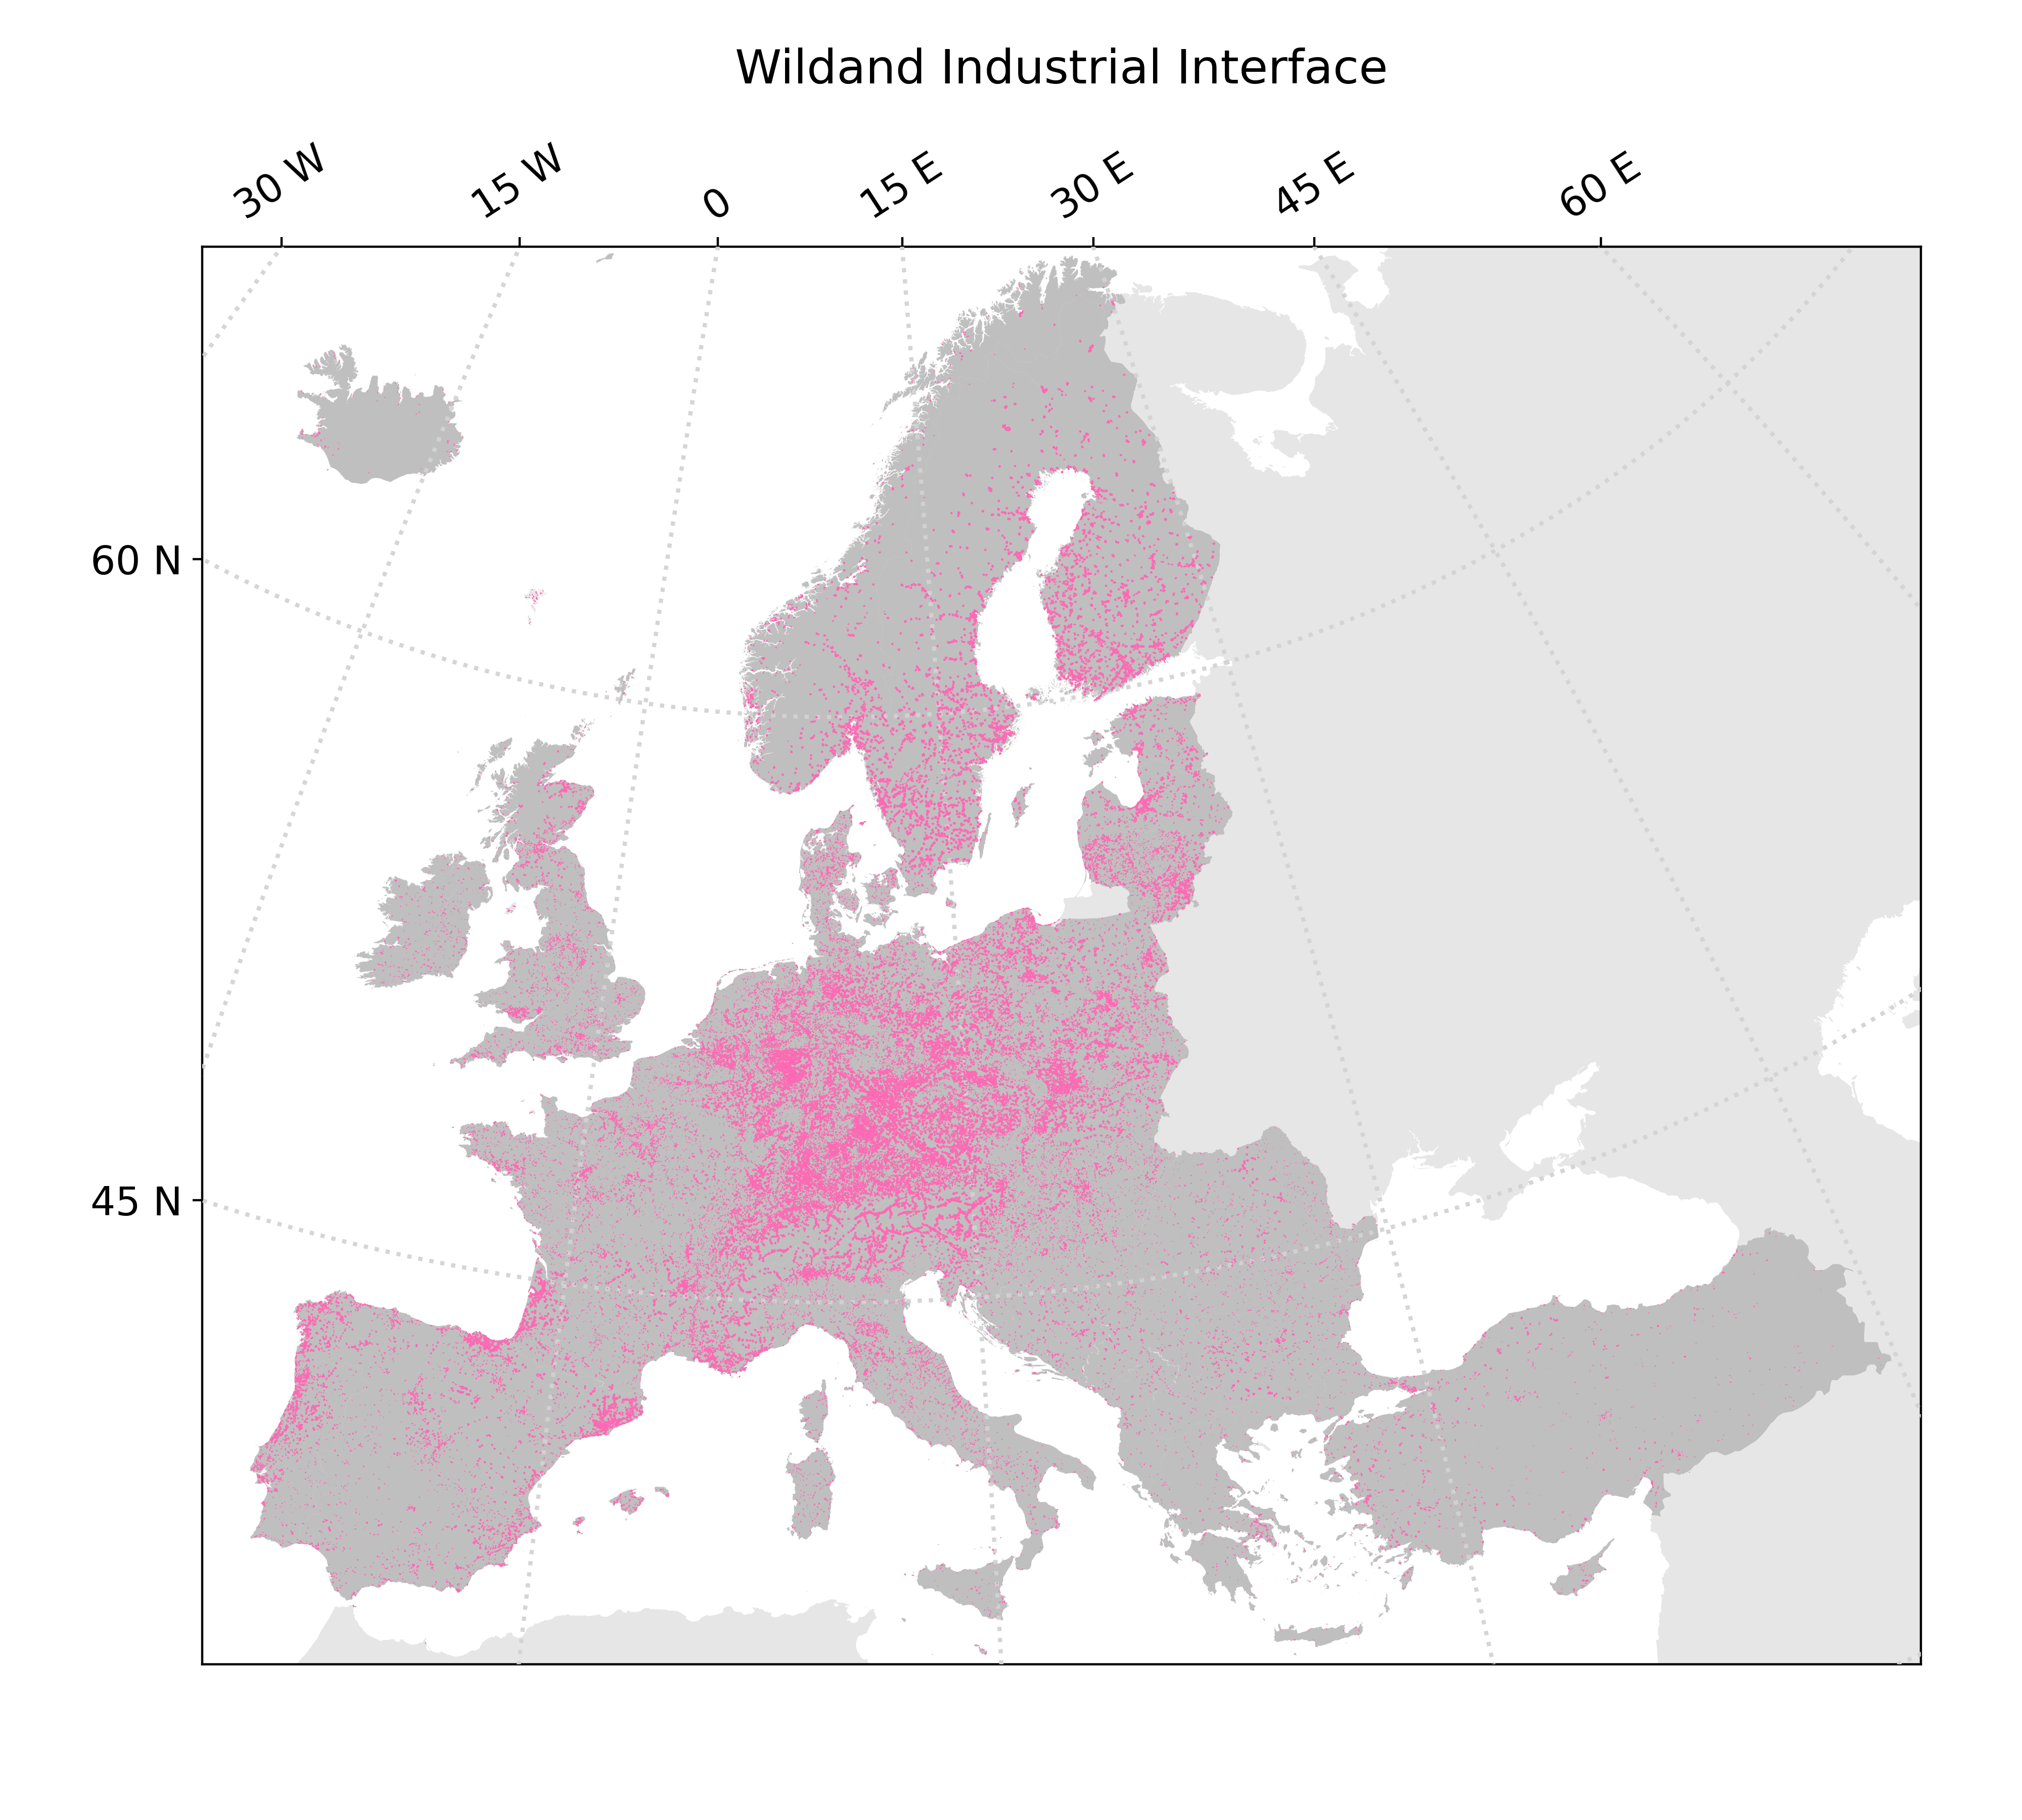 |
The WII map is then computed for each industrial polygon of the OSM data set as the intersection of the buffer area extended around this polygon by a the distance d_inter(r_fh) and vegetation polygon of fire hazard category r_fh.
The interactive map above shows the WII global map computed with this methodology. The map shows first the percentage of WII per Vegetation area at province level. If you zoom in, then you have acces to the WII map.
References
- Planas Eulalia, Ronan Paugam, Alba Àgueda, Pascale Vacca, Elsa Pastor, Fires at the wildland-industrial interface. Is there an emerging problem?, Fire Safety Journal, Vol 141, 2023.
- Johnston, L.M., Flannigan, M.D., Mapping Canadian wildland fire interface areas. International Journal of Wildland Fire, Vol 27, 1-14, 2018
- Vega-García, C., Chuvieco, E., Applying Local Measures of Spatial Heterogeneity to Landsat-TM Images for Predicting Wildfire Occurrence in Mediterranean Landscapes. Landscape Ecol 21, 595–605, 2006.