Collecting Data from Multiple Modis Overpasses
April 2015
The fire shown in the above images was in 2015 the highest plume available in the MISR data set with a top plume height of 12 km. I developed an algorithm which can automatically extract from the MODIS archive all overpasses from the Terra and Aqua satellite above a given location over a specified time period. The algorithm is currently designed to extract the MIR and the TIR bands, compose a color composite image, and read the cloud (MOD06) and fire (MOD14) official products. All images and products are georeferenced on a 500m resolution grid using data from the MOD03 product.
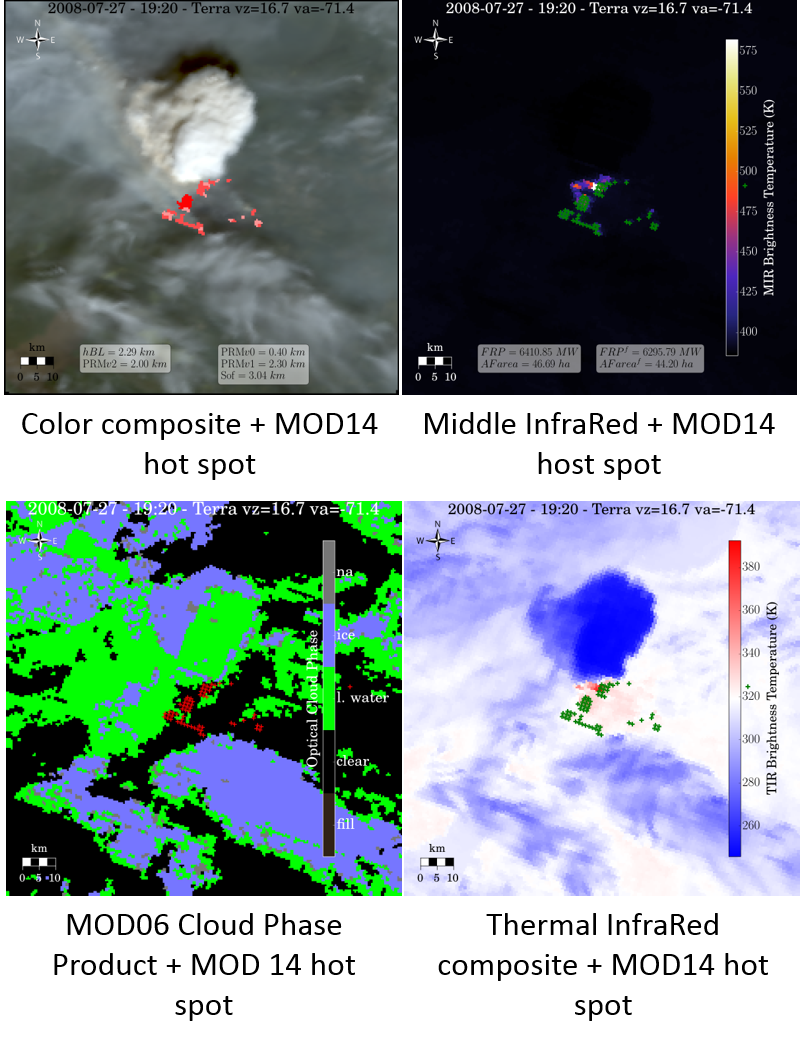
In the above image: upper top left panel is a color composite images made from the MODIS bands 0.6 (red,R), 0.55 (green,G) and 0.47 μm (blue,B) and geo-referenced on a 120x120 km 2 grid with a 0.5 km resolution around the location of the MISR detected fire. The top and bottom right panels show brigthness temperature in the middle infra red (band 21 at 3.9 μm) and long wave infra red (band 31 at 10.780-11.280 μm), respectively. The green crosses in each images mark the location of the fire pixels from the MOD14 product. The bottom left panel shows the optical cloud phase as reported in the official MOD06 product.
In the color composite images, height of the boundary layer from ECMWF forecast product is reported (hBL), as well as the plume height as derived from the original Plume Rise Model (PRMv0) of Freitas et al. (2007), updated versions of PRMv1 from Val Martin et al. (2012) and PRMv2 from Paugam et al. (2015). Result form the parameterization of (Sofiev et al., 2012, Sof ) is also shown.
In the MIR images, FRP from the biggest fire cluster formed of MOD14 pixels and located within 20 km of the fire location is reported. The Active Fire (AF) area (AF area) of the fire cluster derived from the Dozier (1981) algorithm are also reported. When hot spot with hight temperature are present (T pixel > 600 K), a filter is applied to remove cool (i.e. smoldering) pixels and FRP and AFarea of the new filtered cluster are indicated. For each pixel, T pixel is derived from the Dozier (1981) algorithm applied at the pixel level.
Time series of the overpass of the fire shown above can be seen here in different format:
- pdf (colorComposite+MIR or cloudPhase+TIR)
- google earth (MIR or colorComposite).
References:
- Dozier, J.: A method for satellite identification of surface temperature fields of subpixel resolution, Remote Sens. Environ., 11, 221–229, doi:10.1016/0034-4257(81)90021-3, 1981.
- Freitas, S. R., Longo, K. M., Chatfield, R., Latham, D., Silva Dias, M. A. F., Andreae, M. O., Prins, E., Santos, J. C., Gielow, R., and Carvalho Jr., J. A.: Including the sub-grid scale plume rise of vegetation fires in low resolution atmospheric transport models, Atmos. Chem. Phys., 7, 3385–3398, doi:10.5194/acp-7-3385-2007, 2007
- Paugam, R., Wooster, M., Atherton, J., Freitas, S. R., Schultz, M. G., and Kaiser, J. W.: Development and optimization of a wildfire plume rise model based on remote sensing data inputs – Part 2, Atmos. Chem. Phys. Discuss., 15, 9815-9895, https://doi.org/10.5194/acpd-15-9815-2015, 2015
- Sofiev, M., Ermakova, T., and Vankevich, R.: Evaluation of the smoke-injection height from wild- land fires using remote-sensing data, Atmos. Chem. Phys., 12, 1995–2006, doi:10.5194/acp-12-1995-2012, 2012
- Val Martin, M., Kahn, R. A., Logan, J. A., Paugam, R., Wooster, M., and Ichoku, C.: Space-based observational constraints for 1-D fire smoke plume-rise models, J. Geophys. Res. Atmos., 117, D22204, doi:10.1029/2012JD018370, 2012